Analysis
Data pre-processing
We start by downloading the hyperspectral map from NASA's EMIT mission official website and then perform orthorectification. Afterward, we normalize the data using various indices, such as NDVI, NDWI and NDMI.

Normalized Difference Vegetation Index (NDVI):
NDVI is closely linked to the presence of vegetation. Elevated NDVI values indicate regions that exhibit greater reflection in the near-infrared spectrum. Increased near-infrared reflectance is indicative of more abundant plant growth.
We use NDVI ((842nm-665nm)/(842nm+665nm)) < 0.35 to remove low vegetation areas.

Normalized Difference Water Index (NDWI):
NDWI utilizes the green and near-infrared bands of remote sensing imagery and is particularly responsive to the presence of water areas.
We use NDWI ((560nm -842nm)/(560nm +842nm)) > 0 to remove water areas.

Normalized Difference Moisture Index (NDMI):
NDMI is calculated from NIR and SWIR values. It is sensitive to water content in vegetation.
We use NDMI ((842nm-1610nm)/(842nm+1610nm)) > 0.2 to remove farm because natural vegetation is drier than agricultural land in the Cape of South Africa.
Method
In our hypothesis, where regions with high plant biodiversity represent a relatively small proportion of the total considered areas. Due to numerous rare species concentrated in the area, it is expected that the vegetation in these regions would exhibit the greatest difference from that of other areas. These differences will reflect on the spectrum.
To find the plant biodiversity, we calculate Z-score for specific wavelength intervals in the spectral data of each pixel. These Z-score data could help identify grid points with the most significant deviations in spectrum.
Subsequently, creating maps that colored with Z-score will facilitate the identification of areas with the plant biodiversity hotspot.
Result
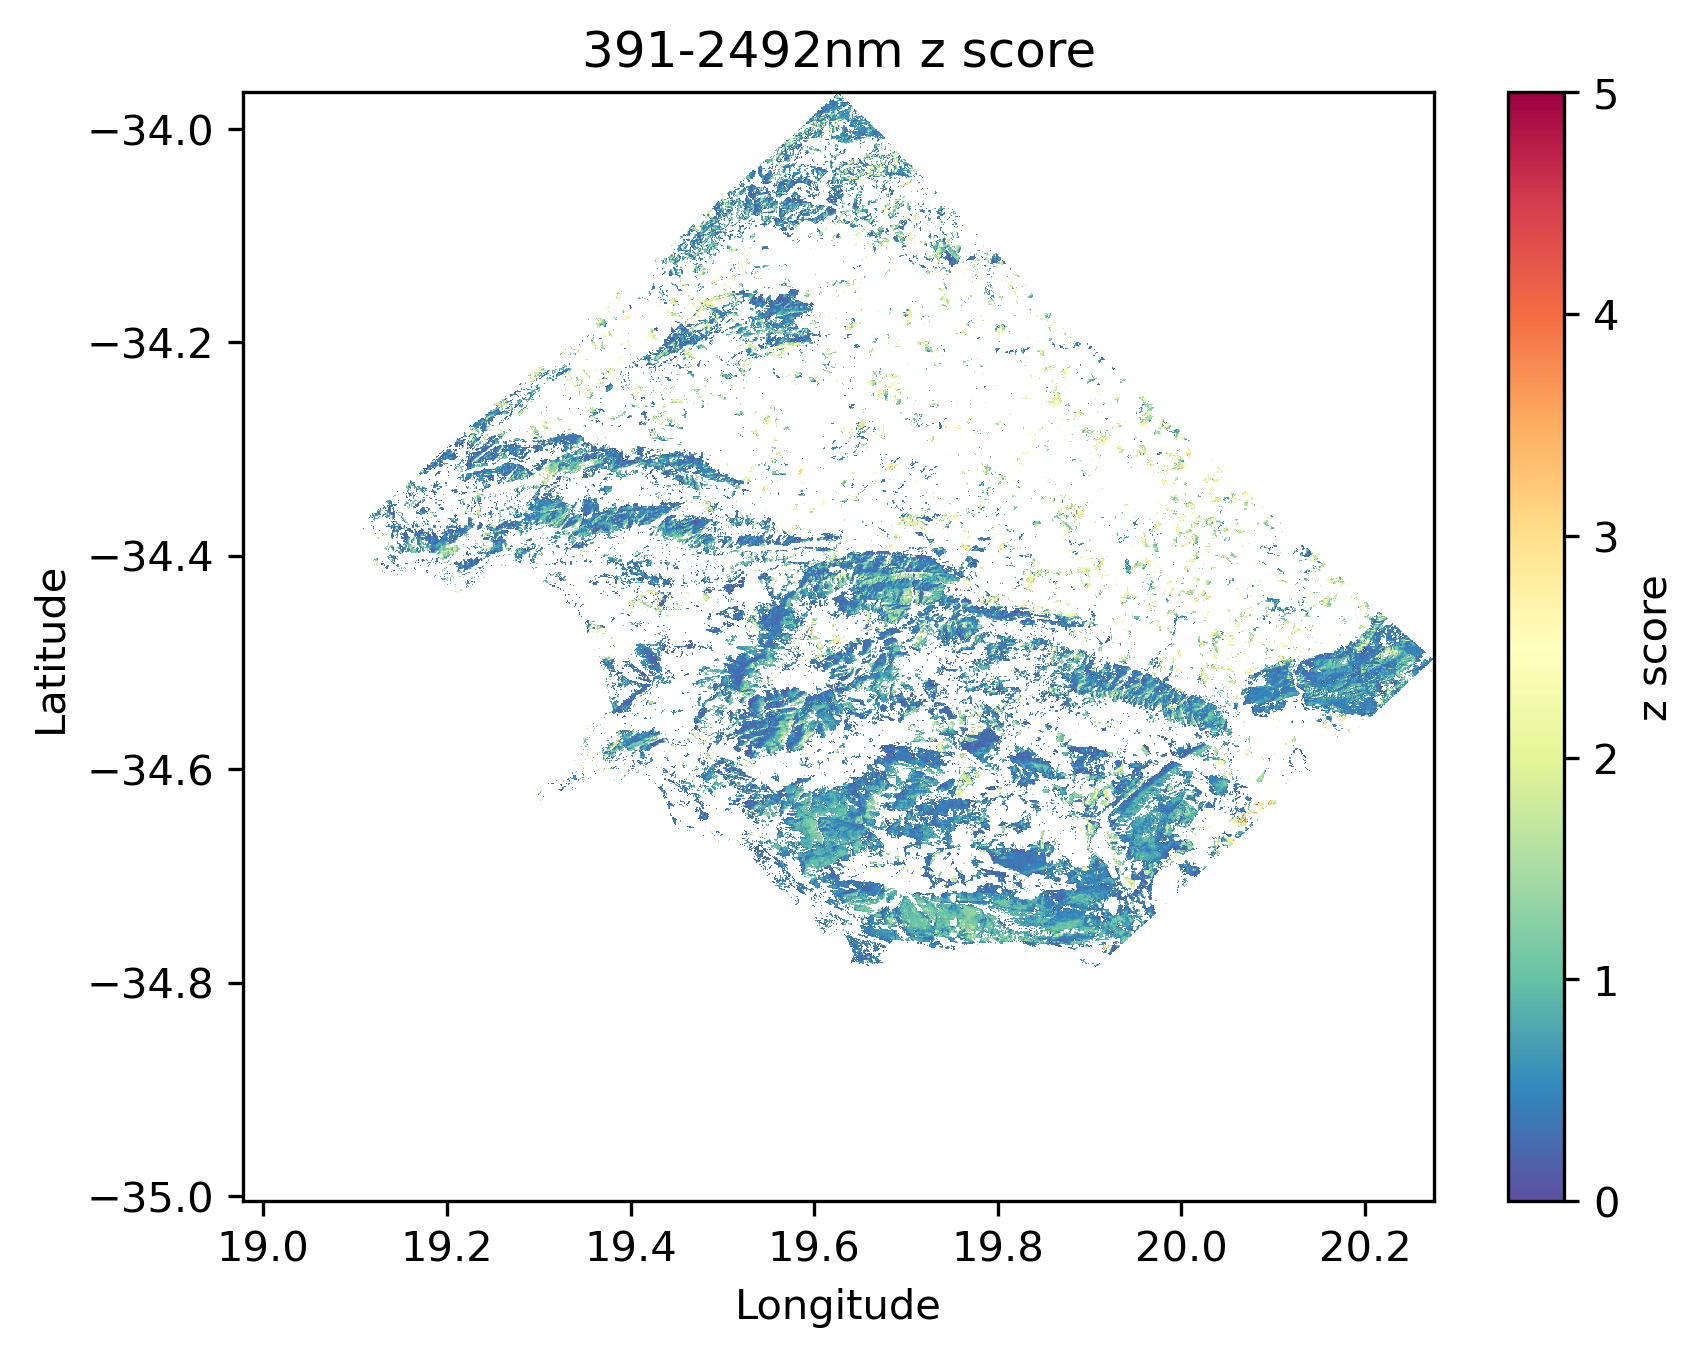

This is our Z-score analysis result, we successfully distinguish water and farm from vegetation, but we had a hard time in buildings and sand distinguishing. So, in the last step we manully pick the hot spot accroding to Z-score value and Satellite imagery. Hotspots search results are presented as interactive map.